Loading…
🌏 Community Medicine · Part 4 revision hub
Biostatistics and Research Methods
Everything you need to revise this Part in one place — the one‑page note for every concept, a rapid‑revision sheet, exam‑style questions that point you back to the right concept, flashcards, staged cases and viva practice.
10 concepts20 MCQs20 flashcards4 cases15 viva questions
📝 The plate wall
Every concept in this Part as a one‑page handwritten note. Open one to read it in full and zoom.
Concept 28
Kinds of Data
Concept 29
Tables and Graphs That Tell the Truth
Concept 30
The Middle of the Data — Averages
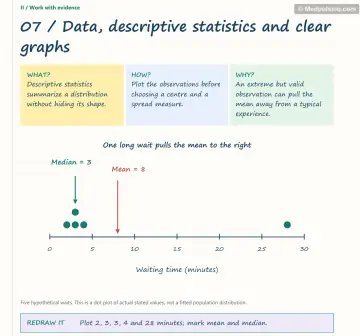
Concept 31
How Spread Out Is the Data?
Concept 32
The Bell Curve and the Standard Error
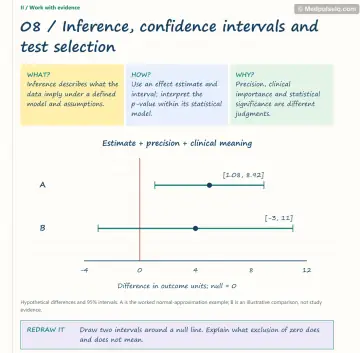
Concept 33
Is the Difference Real? — p-Values and Errors
Concept 34
The Range of Plausible Answers — Confidence Intervals
Concept 35
Choosing the Right Statistical Test
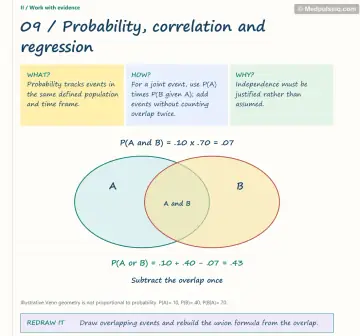
Concept 36
Do Two Things Move Together? — Correlation and Regression
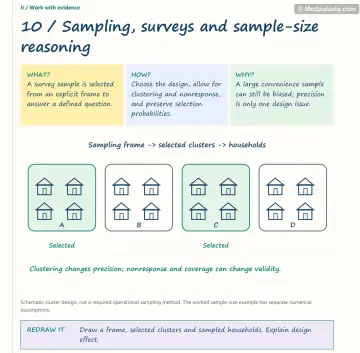
Concept 37
Choosing Who to Study — Sampling and Sample Size
⚡ Rapid revision
The whole Part on one screen — read it the night before.
Data and display
- Nominal (no order) → ordinal (order) → interval (equal gaps, no true zero) → ratio (true zero). Discrete = counts; continuous = measured.
- Bar/pie = categorical; histogram (adjacent bars, area ∝ frequency), frequency polygon, box plot = continuous; line = time; scatter = two quantitative; choropleth = rates.
- Ogive: less‑than and more‑than curves intersect at the median.
Centre and spread
- Mean (symmetric), median (skewed, ordinal), mode (nominal), geometric mean (titres, multiplicative data).
- Right skew: mean > median > mode. Mode ≈ 3 median − 2 mean.
- Range, IQR (with median), variance s² = Σ(x − x̄)²/(n − 1), SD (with mean), CV = SD/mean × 100.
- Normal: 68.3 / 95 (1.96 SD) / 99.7%. Z = (x − μ)/σ.
- SE = SD/√n: precision of the mean; ↓ with n. SE(p) = √[p(1 − p)/n].
- WHO growth: < −2 SD moderate, < −3 SD severe (stunting, wasting, underweight).
Inference
- p‑value: probability of data at least this extreme if H₀ is true. It is not P(H₀) and not effect size.
- Type I (α) = false positive; Type II (β) = false negative; power = 1 − β (80–90%).
- 95% CI = estimate ± 1.96 SE; ratios computed on the log scale. Difference CI excluding 0, or ratio CI excluding 1 → significant at 5%.
- Non‑significant ≠ no effect: check power and CI width.
Tests
- Unpaired t / Mann–Whitney; paired t / Wilcoxon signed‑rank; ANOVA / Kruskal–Wallis; Pearson / Spearman; χ² / Fisher; McNemar (paired binary).
- χ² df = (r − 1)(c − 1); 2×2 critical value 3.84.
- Correlation ≠ agreement (use Bland–Altman) ≠ causation. Logistic → OR; Poisson → rate ratio; Cox → HR.
Sampling
- SRS, systematic (periodicity), stratified (precision, representation), cluster (design effect), multistage (NFHS), multiphase, PPS.
- n = Z²pq/d²; × DEFF; ÷ response rate; 4pq/L² shortcut.
🎯 Single‑best‑answer MCQs
Pick an answer to see the explanation — and the concept to revisit if you missed it. Your answers are saved on this device.
Score 0 / 00 of 20 answered
Question 1
Socio‑economic class measured as I to V is on which scale?
Question 2
Temperature in degrees Celsius is measured on which scale?
Question 3
The most suitable diagram to show the frequency distribution of systolic BP in 500 adults is:
Question 4
The "less than" and "more than" ogives intersect at the:
Question 5
For a positively (right) skewed distribution:
Question 6
The most appropriate average for antibody titres is the:
Question 7
The measure of dispersion best paired with the median is the:
Question 8
The coefficient of variation is:
Question 9
In a normal distribution, the proportion of values lying beyond ±2 SD from the mean is approximately:
Question 10
SD of Hb is 1.2 g/dL in a sample of 144. The standard error of the mean is:
Question 11
A Type II error is:
Question 12
Power of a study increases with all EXCEPT:
Question 13
An odds ratio of 2.1 (95% CI 1.4–3.2) indicates:
Question 14
Increasing sample size fourfold will make the 95% CI width approximately:
Question 15
Comparing the proportion of smokers among cases and controls uses the:
Question 16
The non‑parametric equivalent of the paired t‑test is the:
Question 17
Paired binary data (test result before and after training in the same patients) are analysed with:
Question 18
A correlation coefficient of −0.9 indicates:
Question 19
To assess agreement between two methods measuring Hb, the appropriate method is:
Question 20
Selecting every 10th household after a random start is:
🃏 Flashcards
Say the answer out loud before you flip. Shuffle once you know the order.
Card 1 of 20
🩺 Staged clinical cases
Read the presentation, decide what is going on and what you would do — then reveal the reasoning.
Case 1 — The misleading average
Stage A: A district report states that "average out‑of‑pocket spending on delivery is ₹6,200". Field staff say most families pay almost nothing in government facilities.
Linked concepts: 30. The Middle of the Data — Averages, 31. How Spread Out Is the Data?
Case 2 — "No significant difference"
Stage A: A pilot of 50 diabetics compares an SMS reminder with usual care. The mean HbA1c difference is −0.4% (p = 0.18). The team concludes "SMS reminders don't work".
Case 3 — Choosing tests for an anaemia project
Stage A: A student measures Hb in 80 adolescent girls before and after 3 months of weekly IFA, records anaemia (yes/no) at both times, and compares post‑intervention Hb across three schools.
Linked concepts: 35. Choosing the Right Statistical Test, 28. Kinds of Data
Case 4 — Planning a coverage survey
Stage A: A DIO wants to estimate measles‑rubella second‑dose coverage (expected 70%) with ±5% precision in a district without a household list.
🎤 Viva practice
Answer aloud as if an examiner asked you — then check the model points.
Viva 1
What are the scales of measurement?
Viva 2
Differentiate a histogram and a bar chart.
Viva 3
When do you use the median instead of the mean?
Viva 4
What is standard deviation?
Viva 5
Differentiate SD and SE.
Viva 6
Properties of the normal distribution?
Viva 7
What is a Z‑score?
Viva 8
Define the null hypothesis and the p‑value.
Viva 9
Define Type I and Type II errors.
Viva 10
What is power, and what determines it?
Viva 11
What is a confidence interval?
Viva 12
Which test would you use to compare means of two independent groups?
Viva 13
What is the chi‑square test used for?
Viva 14
Differentiate correlation and regression.
Viva 15
List probability sampling methods.
Keep going
Educational only — not a substitute for clinical judgement, supervision, or local guidelines.